- Welcome
- Use case
- Getting Started
-
Searching Records
- Performing a Basic Search
- Performing an Advanced Search
- Performing a List Search
- Performing a Keyword Search of UUMC Pathology Reports for all Patients in the Database
- Performing a Keyword Search of UUMC Pathology Reports for the Patients Associated with a Specific Set of Specimens
- Restrictions on Searches
- Reports
-
iQ Tool
- Adding Columns to a Query
- Starting the iQ Tool
- iQ Tool Window
- Current Query Data Group
- Saved Queries List
- Top Portion of the Selected
- Display or Report Columns Section
- Find/Filters Section
- Running a Preexisting Query
- Creating a Query
- Create Query Window
- Copying and Altering a Preexisting Query
- Removing Columns from a Query
- Editing Column Parameters in a Query
- Changing the Order of Columns in a Query
- Adding Filters to a Query
- Editing Filters in a Query
- Ways of Comparing Data
- Removing Filters From a Query
- Results Window
- Application Data Structure
- Application Database Fields Alphabetical List
- Application Datatree
- Field Paths List for the iQ Tool
-
Adding Specimens to the Database
- Adding a Single Specimen using the Add Specimen Wizard
- Adding a Batch of Specimens using the Add Specimen Expert Tool
- Saving a Batch of Specimens to be added as a Work in Progress
- Finishing a Work in Progress Batch
- Printing Barcodes for a Specimens in a Batch added using the Add Specimen Expert Tool
- Customizing the Add Specimen Expert Tool to Streamline Specimen Batch Entry
- Changing which Box an Add Expert Template Points for Adding Storage
- Importing FFPE Samples from UUMC
- Entering and Editing Specimen Records
- Transformations
- Specimen Disbursement and Registration
- Reports and Records
- Adding a Pathology Report to a Specimen Record
- Performing a DEXT Import of a Pathology Import
- Checking on the status of your DEXT Import Request
- Adding a Medical Record to a Specimen Record
- Editing Patient or Collection Records
- Editing Collection Records
- Editing Patient Records
- Diagnoses
- Adding a Diagnosis to a Patient Record
- Linking an Existing Diagnosis to one or more Collections
- Linking a Collection to a Diagnosis
- Recording a Consent for a Patient
- Reviewing a Patient's Consents
- Uploading a Patient's Consent Form
- Managing Patient Consents
- External (to itBioPath) Data Sources
- Managing Dictionaries
-
Storage
- Editing Aliquots
- Connecting a Barcode Label Printer to itBioPath
- Removing a Barcode Label Printer from itBioPath
- Freezer Management
- Viewing the Contents of a Box in a Freezer
- Accessing the Specimen Record for the Specimen associated with an Aliquot
- Editing Box Details
- Adding a New Box to a Freezer from the Add Aliquot Window
- Managing Protocols, Projects, and Related User Permissions
- Window, Tab, and Field Descriptions
- Miscellaneous
The structure of the applications database is actually quite complicated. Normally, you would not need to worry about how the database stores its information, because the application typically handles these details behind the scenes. However, as you use the iQ reporting tool to set up columns and filters for your query, you will be confronted to some extent with some of the details of this data structure that you have not had to deal with before. Column fields and filters do not just point at single fields from the application but at entire data paths that link the various pieces of data together.
The fields that are available to add as either columns in the query results or as filtering criteria for a query are essentially the same fields that appear on various windows throughout the application. In order to add a field to either grid (the Display section (Report Columns) or Find section (Filters) grids) you will need to know how to navigate the application data structure to find the field you want. The reason for this is to make sure that, as you are assigning fields to the various columns and filters, the iQ query tool knows how each of those fields relates to the others in a given record and can display this information together in a way that links common record elements together on the same row. At first this will seem a bit confusing and finding the right data path that will lead to the information you want displayed in a particular column but you will become familiar with the various data paths and you will find that selecting the field you want is easy.
It can be very helpful to think of the applications data structure much like the folders or directories on a disk, with related elements grouped together in directories and subdirectories.
When first creating the query, the kind of database record that you specify you want to query on (displayed in the Query On field) determines your starting place (or you might say the root directory) in the database structure. Headers with  next to the name indicate groupings of related fields while a
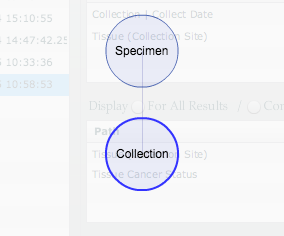
  icon represents each field itself. When you click on a header with , the display changes to show you the contents of that folder and the selected folder is added to the path being built on the right (Visualized by the large circles with header titles). The goal is to select progressively more specific folders or data groupings until the field you are looking for itself can be found, in which case the Query Path that has been built will be entered in the Query Path column for the row in the Report Columns or Filters grids. (See also Adding Columns to a Query and Adding Filters to a Query.)
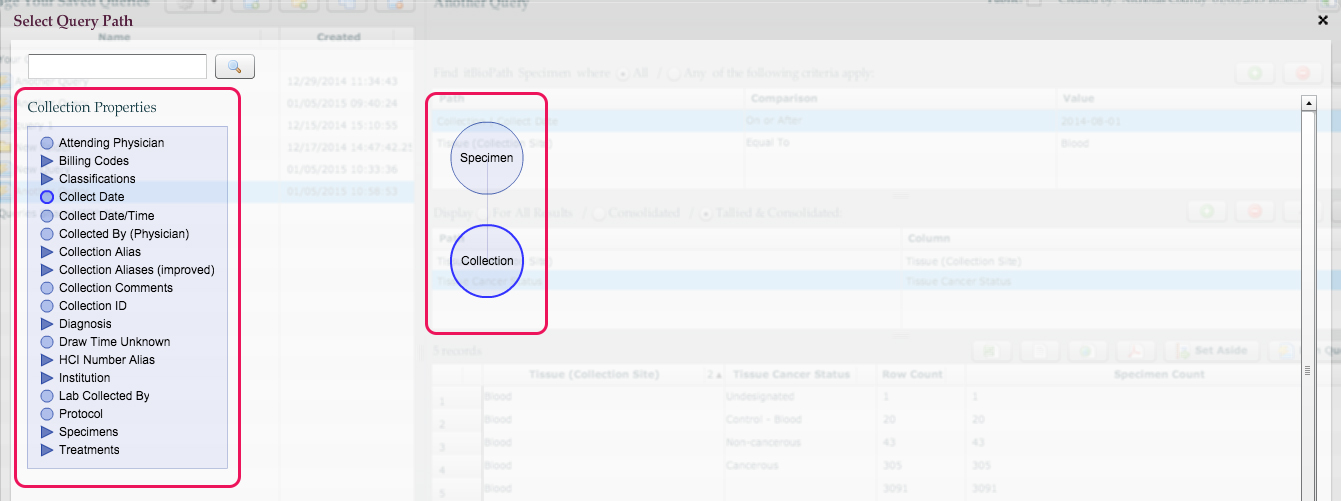
As you are searching for the fields you want in the application data structure, if you happen to open a folder that turns out to be a wrong turn it is very easy to back up along the data path and take a different direction. Simply click on the previous circle that is earlier along the path. The folders contents will be displayed in the Properties data window and you can choose a different folder or field from the list of items presented.
You may also search for the query path using the search bar above the Properties section.
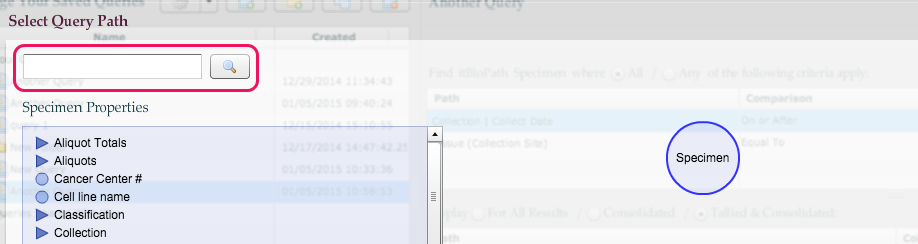
Some subfolders may actually refer you back to folders you have already looked in. For example, within a header called Specimen there may be a Collection header. However, if you click on the Collection folder, one of the options presented inside that folder might be another folder labeled Specimens. If you click this header, even though it is a sub-header of Collection, it will take you back to the original Specimens header. You could actually continue indefinitely clicking Collection and Specimens and you would just go back and forth between the two folders without making any progress at all. (By the way, in such a case there will be other selections available in each of these folders, so there is no reason a user must be caught in this loop.) There is a good reason that the database is set up this way, but it does confuse things a little when it comes to using the iQ reporting tool.
The key is to do a little exploring, pay attention to the names of folders and the ways data is grouped together in them, and as you become more familiar with the data structure, you will find that it will not be that difficult to find the field you are looking for — usually within one or two levels of the surface if not appearing directly on the first level presented to you in the window. Additionally, to help you find your way around, a map of the most commonly used data tree and an alphabetical list of each of the fields available along with its data path is included with this documentation. (See The Application Database Fields Alphabetical List and The Application Data Tree.)