- Welcome
- Introduction
- How to Pages
-
Window and Field Descriptions
- Saved Queries Window
- Add Criteria Window
- Demographics Criteria
- Health Districts
- Last Known Residence
- Alive/Dead
- Pedigree Quality
- Birth Details Criteria
- Diagnosis Criteria
- Diagnosis Criteria Applied to the Utah Cancer Registry
- Diagnosis Criteria Applied to Utah Inpatient Claims and Death Certificates
- Diagnosis Classification
- Procedure Criteria
- Relationship Criteria
- Cohort Builder Window
- Totals Window
- Queries and Aggregation
- Select Grouping Criteria For Results Window
- Birth Order
- Examine Relationships Window
- Relationships
-
Common Error Messages
- Login failed. Please check your user ID and password and try again
- Please fix errors (red) before continuing
- Please select the aggregation criteria you would like to delete
- Please select the aggregation criteria you would like to move
- Please select the criteria you would like to delete
- Please select the query you would like to delete
- Registration Successful
- Server Error Request
- This will delete the selected criteria and all sub-criteria. Continue?
- You have agreed to adhere to the rules set forth in the Data Use Agreement
- You must choose at least one criteria to aggregate by, before running your query.
- You must select at least one criteria to aggregate by.
- Your cohort contains # individuals.
- Your selection did not include any criteria that would limit your cohort.
- Miscellaneous
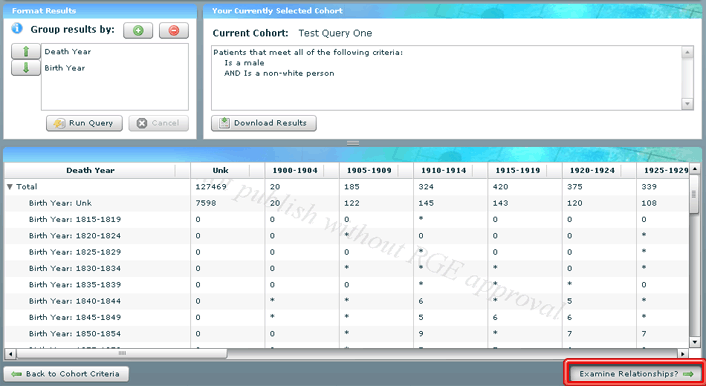
The Totals window is used to enter the aggregation settings for a query and to run that query so that aggregate totals for the various values in the selected fields are displayed. These results may also be downloaded in an Excel spreadsheet format. The Totals window opens after clicking on the Select and Run Aggregation button on the Cohort Builder window. The window reappears after selecting a field for aggregation on the Select Grouping Criteria For Results window.
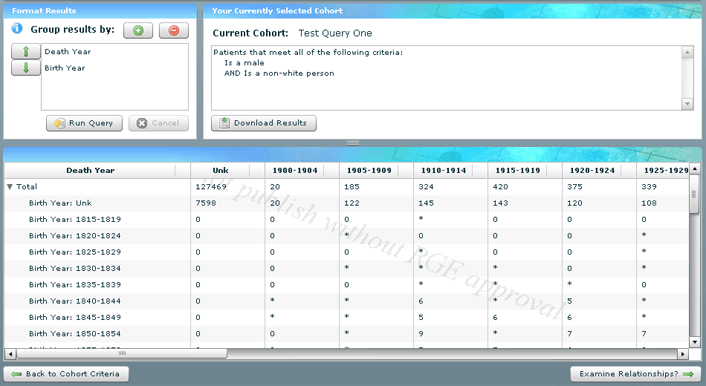
The window is divided into three areas. The first of these areas (top left) is used to specify the fields that will be used to calculate and display aggregate totals from the patient records included in the selected cohort of patients. The selected fields are displayed in list form in this part of the window. The first field in the list provides the values that are to be counted in the aggregate totals displayed in the report. The values or range of values from this field will appear as column headers, and the aggregate totals of records containing the respective values will appear in the columns beneath these headers.
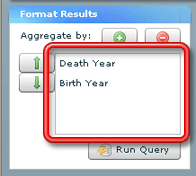
The second and subsequent fields in the list will be used to further break down the aggregate totals of records based on the values present in those fields. These values will appear on the left side of the window in a nested tree structure so that, in the end, each row will represent a unique combination of values (or range of values as appropriate) from these fields. By finding the intersection between a specific row and a specific column, you will then be able to find the exact number of records that match a specific set of values in the selected fields — for more information see the following two paragraphs and Queries and Aggregation.
The order the fields appear on the list is important. For example, if the first field in the list is Death Year, then each column in my report will represent a range of years as will be listed in the column headers. The first row of data in the report will also represent the total number of records in the entire cohort for which the Death Date field shows a value in each of the listed ranges. If there is only one other field specified to aggregate by in the list, Birth Year, then each of the following rows in the report will represent a range of years, and the totals for each field in that row will list the total number of records for which the patient was born during that range of years and died during the range of years at the top of its respective column.
Finally, if a third field is specified for aggregation (for example, Gender), each of the rows listing the total numbers just by Birth Year and Death Year will be followed by a number of rows representing the unique values or range of values for this third field (such as male or female), and the totals on each of these additional rows will represent records with the appropriate Death Year, Birth Year and matching the specified gender. With such a report, you will be able to see totals of records based on ranges of death year. (How many patients in your cohort died between 1955 and 1959?) You will also be able see totals of records based on ranges of death year and birth year. (How many patients in your cohort died between 1955 and 1959 and were also born between 1900 and 1904?) You will be able to see totals of records based on ranges of death year, ranges of birth year and gender. (How many patients in your cohort died between 1955 and 1959, were born between 1900 and 1904 and were male?) But you will not be able see totals of records based on just the birth year or just the gender. Likewise, you will not be able to see totals of records based on the death year and the gender, without taking into account birth year. To get these kinds of totals, you will at least have to rearrange the order of the fields in the list.
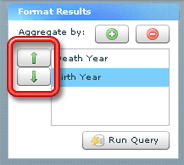
To change the order of the fields in the list, select a field and then use the buttons to the left of the list to move the selected field up or down in the list.
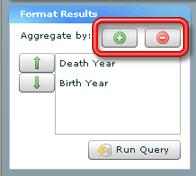
The buttons above the list are used to add fields to the list or to remove them completely from the list so they will no longer be used in aggregation calculations. The + button opens the Select Grouping Criteria For Results window — see The Select Grouping Criteria For Results Window — so that you can select a field to add to the list, while clicking on the — button while a field is selected in the list deletes that field from the list.
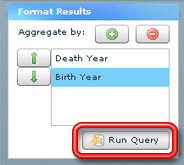
The button beneath the list, Run Query, is used to actually run the query, calculating the specified aggregations. The results of the query will display in the third section of the window described below. Running the query may take a few minutes, so be patient.
The second area of the window contains the name of the current query under the label of Current Cohort: and a description of the cohort that is selected in the current query in similar fashion to how it appears on the Cohort Builder window. There is only one button in this area, which is used to download the results of the query in Excel format — see Running a Previously Created Query. This button will be inactive until the query has actually been run.

The final (and largest) area of the window contains the grid where the results of the query are displayed. A description of how this will appear has already been given above. There is also a watermark displayed with the results that reminds users not to publish any of these results without RGE approval.

If diagnoses are used as one of the aggregated fields, there is an additional feature to make the data results clearer, specifically when dealing with diagnosis criteria based on the Utah Cancer Registry. Because some diagnosis codes for different types of cancer may appear the same on the Totals window, if you drag your mouse over the column or row header for each diagnosis, a text description of what that diagnosis code represents will appear.

There are two buttons at the bottom of the window. The button on the left (Back to Cohort Criteria) moves you back to the Cohort Builder window so that you can make additional changes to the criteria used to select the current cohort — see The Cohort Builder Window.
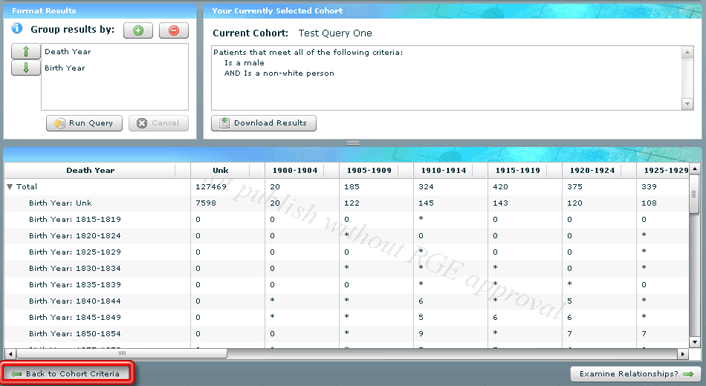
The button on the right (Examine Relationships) moves ahead to the Examine Relationships window so that you can use that tool to analyze the familial relationships found within the selected cohort of records — see The Examine Relationships Window and Examining Relationships Within a Query Cohort.
